Analysing Pi-hole logs with Vector and Amazon Athena
Like so many others I’ve been running Pi-hole on my home network to keep myself safe from the ever-growing list of applications intent on collecting as much data as possible.
Pi-hole, for those who aren’t familiar, is a network-wide ad-blocker that works as a DNS server. Clients can be configured individually or a router can specify Pi-hole as the DNS server, meaning clients connecting to your network are protected by default. When a client makes a DNS request for a host that Pi-hole considers to be bad, Pi-hole acts as a DNS sinkhole .
Whilst Pi-hole does a great job blocking requests, the logging capabilities it provides out of the box are understandably not perfect. You can use Pi-hole’ built-in interface to analyse logs but there are a number of downsides to this; you can only query the logs stored on the box itself (once they are rotated, they are gone) and you can only query the most recent 100 queries, or all queries (nothing in-between).
It’s unreasonable to expect Pi-hole to provide a sophisticated log analysis system out of the box so in this post I’m going to explain how I’ve been using Vector by Datadog and Amazon Athena to analyse my Pi-hole logs.
Vector
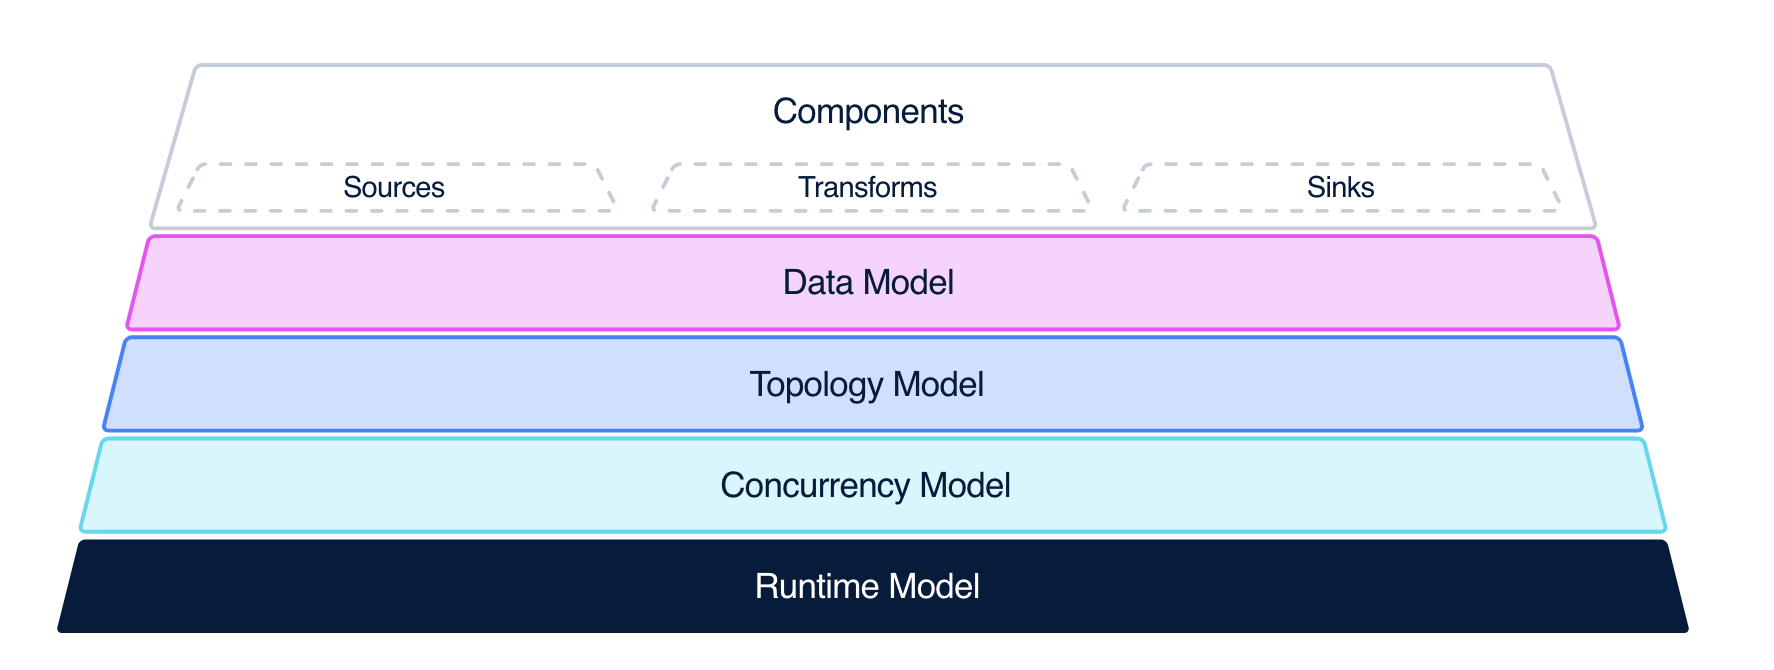
Vector by Datadog is, in their own words, “A lightweight, ultra-fast tool for building observability pipelines”. What makes Vector a perfect choice for this system (and for many others) is its flexible component architecture.
 Image from vector.dev
Vector has three components : Sources, Transforms and Sinks. At a very high level:
- Sources are where Vector receives data from
- Transforms are where Vector can manipulate data
- Sinks are where Vector sends data to
In our example, the Pi-hole log file is our Source, we’ll use Vector Remap Language as our Transform, and Amazon S3 is our Sink.
Vector is configured by a YAML, TOML or JSON file. In this example we’ll be using YAML. We’ll create a config file with our Source, Transform and Sink as described above:
sources:
  pihole_logs:
    type: file
    include:
      - /var/log/pihole.log

transforms:
  add_timestamp:
    type: remap
    inputs:
      - pihole_logs
    source: |
      .blocked = match!(.message, r'blocked')

sinks:
  monitoring_logs_bucket:
    type: aws_s3
    healthcheck:
      enabled: true
    inputs:
      - add_timestamp
    batch:
      timeout_secs: 60
    bucket: pihole-monitoring-pihole-logs
    key_prefix: pihole/%Y/%m/%d/
    region: eu-west-1
    encoding:
      codec: csv
      csv:
        fields:
          - message
          - blocked
          - timestamp
Let’s break this down section by section, starting with our Source:
sources:
  pihole_logs:
    type: file
    include:
      - /var/log/pihole.log
We’re using the file
source, indicated by the
type: file line. This sink allows us to take one or more log files and process them using Vector. In our example we
only need one file, /var/log/pihole.log.
Next up we have our Transform:
transforms:
  add_timestamp:
    type: remap
    inputs:
      - pihole_logs
    source: |
      .blocked = match!(.message, r'blocked')
We’re using the remap
transform which allows us
to modify our log entries using Vector Remap Language (VRL)
, a domain-specific
language in Vector.
We define our input source (pihole_logs) that we defined earlier, and then we add a new field, blocked, which is
set to true or false depending on whether or not the .message field outputted by our source matches a simple
regex.
Finally, we have our Sink:
sinks:
  monitoring_logs_bucket:
    type: aws_s3
    healthcheck:
      enabled: true
    inputs:
      - add_timestamp
    batch:
      timeout_secs: 60
    bucket: my-s3-bucket
    key_prefix: pihole/%Y/%m/%d/
    region: eu-west-1
    encoding:
      codec: csv
      csv:
        fields:
          - message
          - blocked
          - timestamp
We’re using the aws_s3
sink which allows us to ship
our transformed logs to an Amazon S3 bucket.
The configuration is fairly self-explanatory, but note how we’re specifying a key prefix using
Vector’s template syntax
to allow us to include
variables; in our case we are using the year, month and date - objects are uploaded to keys such as
pihole/2024/11/29/<timestamp>-<uuid>.log.gz (this is important when it comes to querying the logs with Athena).
I deploy Vector to the same Raspberry Pi which runs my Pi-hole and run it using systemd :
[Unit]
Description=Pi-hole Monitoring Service
After=network.target

[Service]
ExecStart=/bin/bash -c '/root/.vector/bin/vector --config /root/.vector/config/vector.yaml'
Restart=always
User=root

[Install]
WantedBy=multi-user.target
With Pi-hole logs now collected, transformed, and uploaded to an S3 bucket, let’s explore how to query them using Athena.
Athena
Amazon Athena is a serverless query engine that allows you to query data where it lives using SQL; we’ll configure it using AWS CloudFormation:
AthenaQueryResultsBucket:
  Type: AWS::S3::Bucket
  Properties:
    BucketName: athena-query-results
    LifecycleConfiguration:
      Rules:
        - Id: delete-after-one-month
          Status: Enabled
          ExpirationInDays: 31
        - Id: delete-incomplete-multipart
          Status: Enabled
          AbortIncompleteMultipartUpload:
            DaysAfterInitiation: 3
      PublicAccessBlockConfiguration:
        BlockPublicAcls: true
        BlockPublicPolicy: true
        IgnorePublicAcls: true
        RestrictPublicBuckets: true
WorkGroup:
  Type: AWS::Athena::WorkGroup
  Properties:
    Name: pihole-monitoring
    WorkGroupConfiguration:
      EnforceWorkGroupConfiguration: true
      PublishCloudWatchMetricsEnabled: false
      ResultConfiguration:
        OutputLocation: !Sub "s3://${AthenaQueryResultsBucket}/results"
Database:
  Type: AWS::Glue::Database
  Properties:
    CatalogId: !Ref AWS::AccountId
    DatabaseInput:
      Name: pihole_monitoring
      Description: Pihole monitoring
Table:
  Type: AWS::Glue::Table
  Properties:
    DatabaseName: !Ref Database
    CatalogId: !Ref "AWS::AccountId"
    TableInput:
      Name: logs
      TableType: EXTERNAL_TABLE
      Parameters:
        EXTERNAL: true
        classification: csv
        write.compression: GZIP
        storage.location.template: !Sub "s3://my-s3-bucket/pihole/${!dt}/"
        projection.enabled: true
        projection.dt.format: yyyy/MM/dd
        projection.dt.type: date
        projection.dt.range: NOW-1YEARS,NOW
        projection.dt.interval: 1
        projection.dt.interval.unit: DAYS
      PartitionKeys:
        - Name: dt
          Type: string
      StorageDescriptor:
        Location: !Sub "s3://my-s3-bucket/pihole"
        InputFormat: org.apache.hadoop.mapred.TextInputFormat
        OutputFormat: org.apache.hadoop.hive.ql.io.HiveIgnoreKeyTextOutputFormat
        SerdeInfo:
          SerializationLibrary: org.apache.hadoop.hive.serde2.lazy.LazySimpleSerDe
          Parameters:
            field.delim: ","
        Compressed: true
        Columns:
          - Name: message
            Type: string
          - Name: blocked
            Type: boolean
          - Name: timestamp
            Type: string
We’ll break this down resource by resource.
AthenaQueryResultsBucket:
  Type: AWS::S3::Bucket
  Properties:
    BucketName: athena-query-results
    LifecycleConfiguration:
      Rules:
        - Id: delete-after-one-month
          Status: Enabled
          ExpirationInDays: 31
        - Id: delete-incomplete-multipart
          Status: Enabled
          AbortIncompleteMultipartUpload:
            DaysAfterInitiation: 3
      PublicAccessBlockConfiguration:
        BlockPublicAcls: true
        BlockPublicPolicy: true
        IgnorePublicAcls: true
        RestrictPublicBuckets: true
Athena can be configured to store the results of queries ran in an S3 bucket; we define this bucket here.
WorkGroup:
  Type: AWS::Athena::WorkGroup
  Properties:
    Name: pihole-monitoring
    WorkGroupConfiguration:
      EnforceWorkGroupConfiguration: true
      PublishCloudWatchMetricsEnabled: false
      ResultConfiguration:
        OutputLocation: !Sub "s3://${AthenaQueryResultsBucket}/results"
Next we define a Work Group, which allows us to group queries together so that we can configure settings such as the query engine and where results are stored. There isn’t too much to cover here.
Database:
  Type: AWS::Glue::Database
  Properties:
    CatalogId: !Ref AWS::AccountId
    DatabaseInput:
      Name: pihole_monitoring
      Description: Pihole monitoring
Now we define our database which, again, doesn’t have too much to cover. We’ll be using AWS Glue as our data catalog, which is very common with Athena.
Table:
  Type: AWS::Glue::Table
  Properties:
    DatabaseName: !Ref Database
    CatalogId: !Ref "AWS::AccountId"
    TableInput:
      Name: logs
      TableType: EXTERNAL_TABLE
      Parameters:
        EXTERNAL: true
        classification: csv
        write.compression: GZIP
        storage.location.template: !Sub "s3://my-s3-bucket/pihole/${!dt}/"
        projection.enabled: true
        projection.dt.format: yyyy/MM/dd
        projection.dt.type: date
        projection.dt.range: NOW-1YEARS,NOW
        projection.dt.interval: 1
        projection.dt.interval.unit: DAYS
      PartitionKeys:
        - Name: dt
          Type: string
      StorageDescriptor:
        Location: !Sub "s3://my-s3-bucket/pihole"
        InputFormat: org.apache.hadoop.mapred.TextInputFormat
        OutputFormat: org.apache.hadoop.hive.ql.io.HiveIgnoreKeyTextOutputFormat
        SerdeInfo:
          SerializationLibrary: org.apache.hadoop.hive.serde2.lazy.LazySimpleSerDe
          Parameters:
            field.delim: ","
        Compressed: true
        Columns:
          - Name: message
            Type: string
          - Name: blocked
            Type: boolean
          - Name: timestamp
            Type: string
Finally, we create the Table which will hold our log data. Most of this is fairly self-explanatory so I won’t go into too much detail, but the particularly powerful parameters are the ones that enable us to use partition projection . Partition projection allows Athena itself to determine partition information instead of needing to perform a more expensive (in terms of time) look up in AWS Glue Data Catalog. Partition projection is particularly useful when you have high-cardinality but well-understood partitions, such as dates.
When we configured our Vector sink earlier we included a key prefix of key_prefix: pihole/%Y/%m/%d/ which, when
combined with our bucket name, means logs are pushed to objects such as
s3://my-s3-bucket/pihole/2024/11/29/<timestamp>-<uuid>.log.gz. We reflect this in our table properties above:
storage.location.template: !Sub "s3://my-s3-bucket/pihole/${!dt}/"
projection.dt.format: yyyy/MM/dd
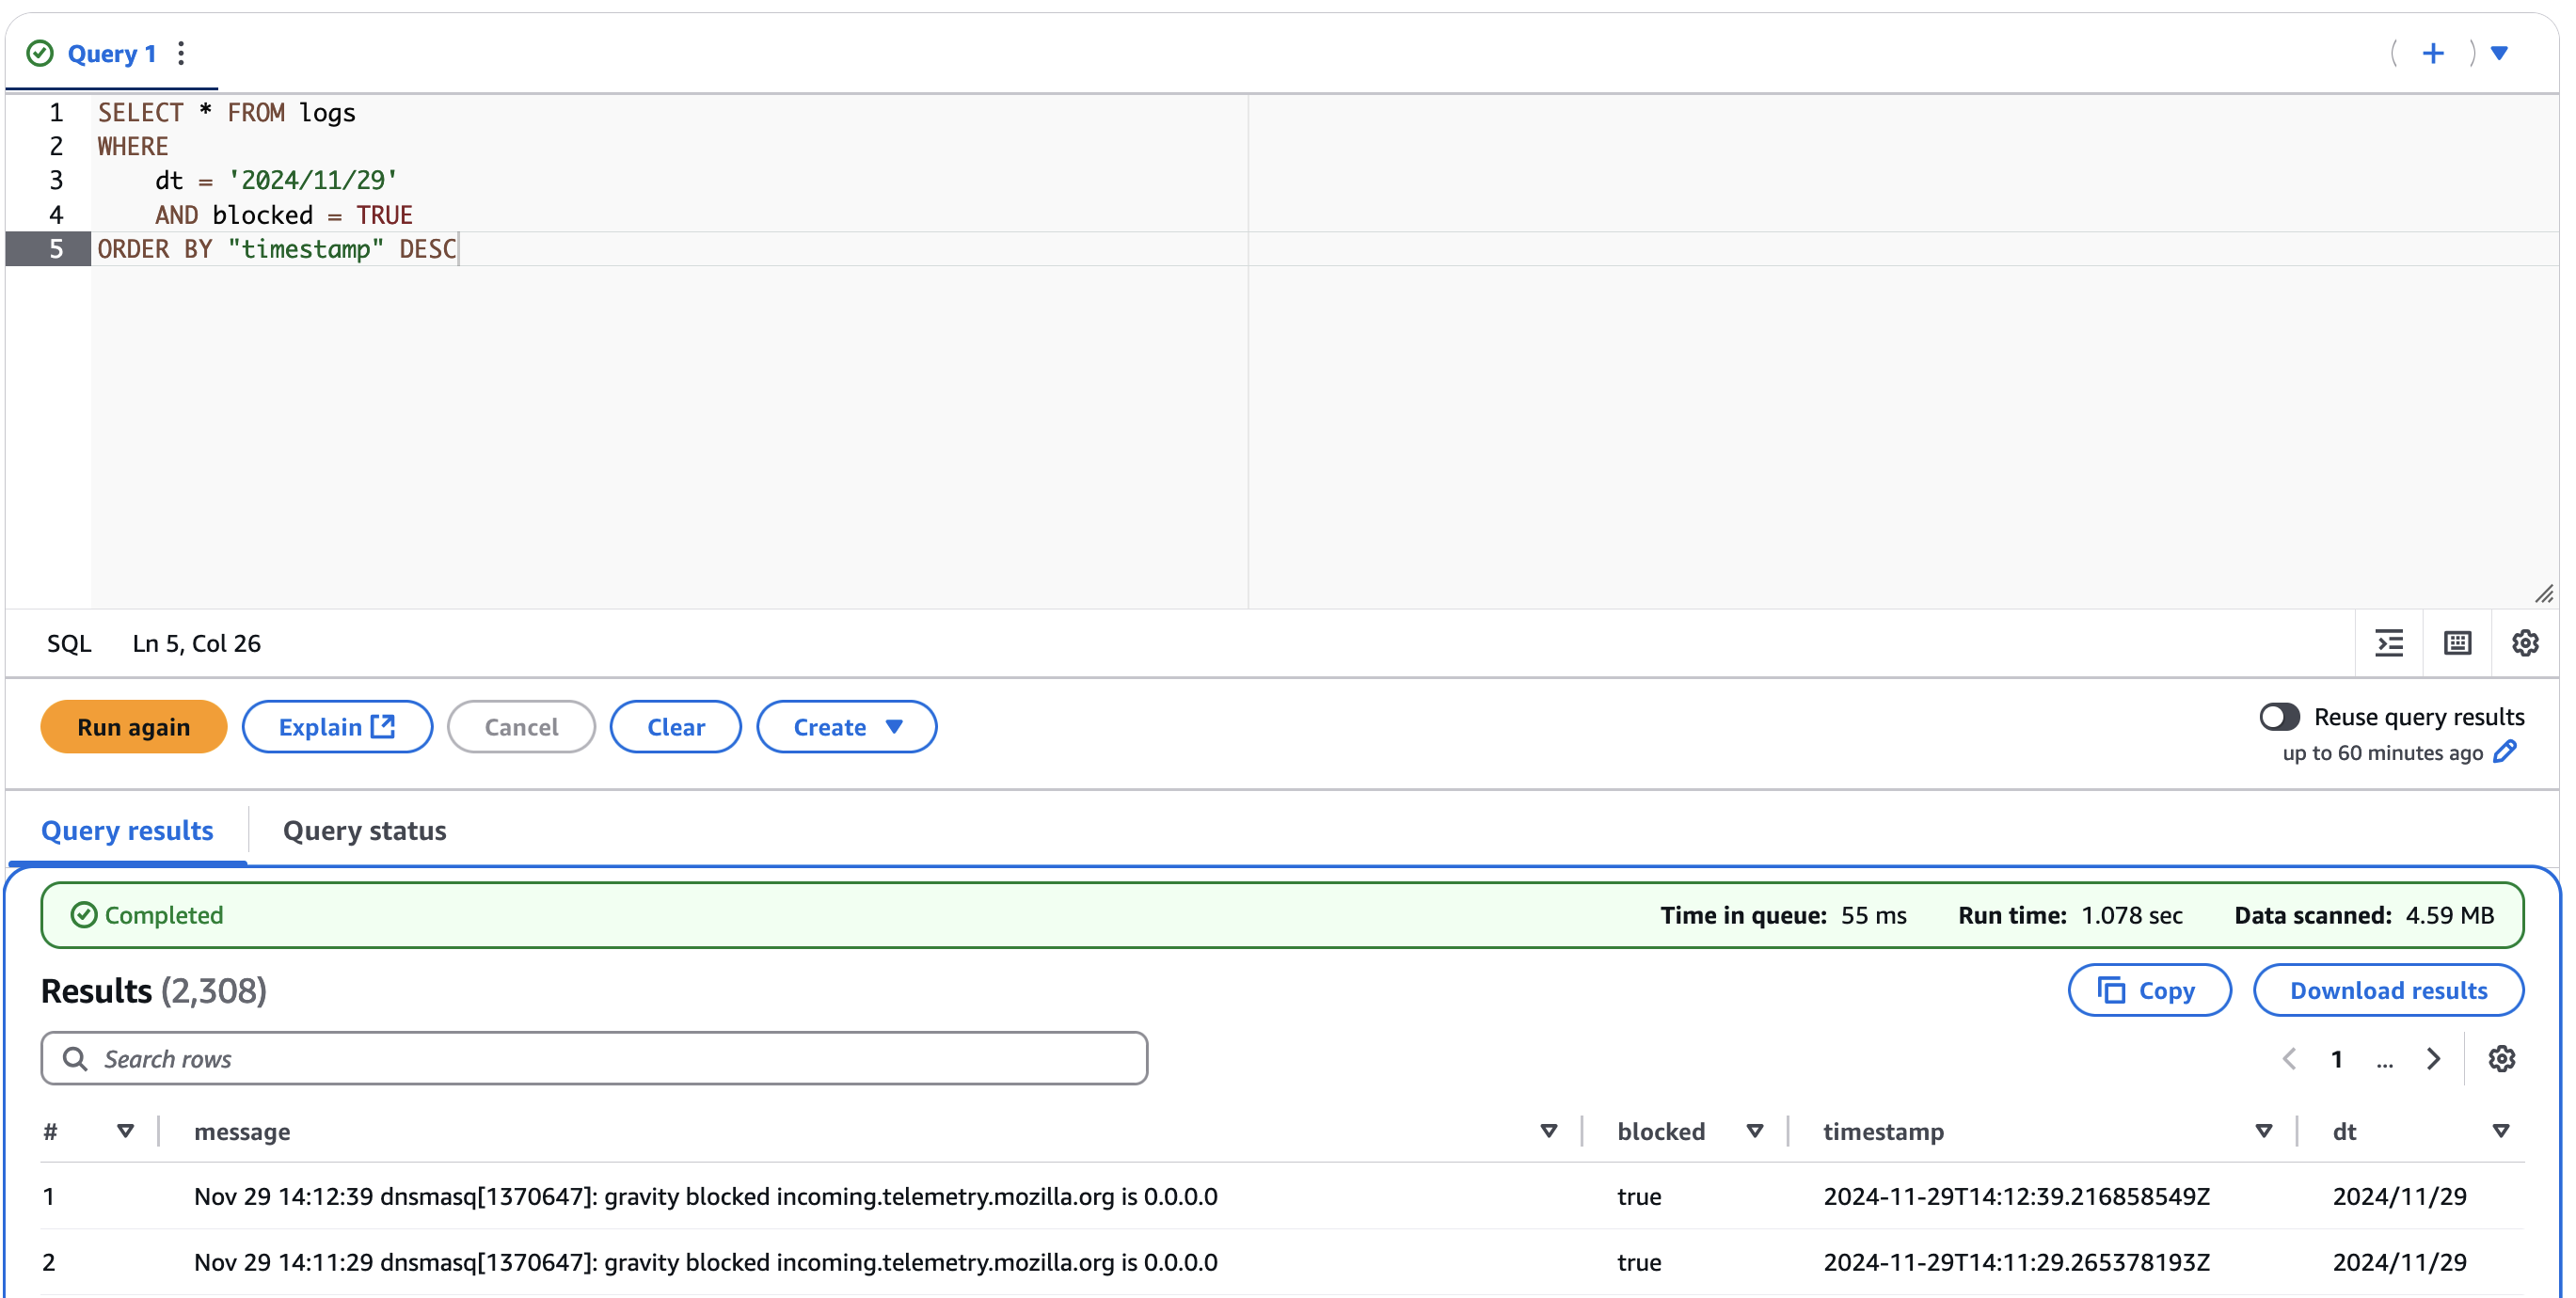
This allows us to refine our Athena queries to focus on a particular date:
SELECT * FROM logs
WHERE
    dt = '2024/11/29'
    AND blocked = TRUE
ORDER BY "timestamp" DESC
This has a time benefit as our query results are returned faster, and a cost benefit as Athena charges you by the amount of data scanned.
At this point we have everything we need to be able to query our Athena logs:

It’s a fairly simple solution that I’m sure can be improved; I’d like to take a look at extracting some more information from the Vector logs (such as what domain was blocked) but it’s a working solution that meets my needs for now.
If you have any questions, comments or general feedback you can reach me at alex@cheste.rs or on Bluesky @cheste.rs .